
MCP Inspector is the reference tool for testing and debugging MCP servers. It runs in the browser, terminal and command line, and covers the three most common usage modes: web, CLI and TUI. The official documentation was updated on October 8, 2026.
Dicas7 min
MCP Inspector: How to Test and Debug MCP Servers Locally
MCP Inspector is the reference tool for testing and debugging MCP servers in the browser, CLI and terminal. See how to install and use it in CI.

Marcelo Santiago
Criador do bridgecode
The biggest AI newsletter in the World
Get AI articles in your inbox
Technical curation on models, agents and coding tools. No spam, unsubscribe anytime.
In this article you will see:
- What MCP Inspector is and when to use it.
- How to install and run in the three modes: web, CLI and TUI.
- How to inspect a local or remote server.
- How to use MCP Inspector in CI and automated workflows.
- Security considerations for secrets and local storage.
What is MCP Inspector
MCP Inspector is the reference development tool for testing and debugging MCP servers. It lets you list tools, call functions, read resources, inspect prompts and track JSON-RPC traffic between client and server.
The tool comes in a single package, @modelcontextprotocol/inspector, which installs a binary called mcp-inspector. Three clients share the same core: web (graphical interface in the browser), CLI (scriptable, for automation) and TUI (terminal interface). All use the same transports, configuration files and protocol negotiation.
The package also installs mcpdo, an experimental client that keeps an open connection between multiple commands.
Prerequisites
MCP Inspector requires Node.js 22.19.0 or newer. There is no need to install anything globally: everything runs via npx.
If you are debugging a Python server, install uv or pipx to run the server with uvx or python. If you are debugging a Node server, have node and npm available.
How to run in web mode
Web mode is the default. It opens a graphical interface in the browser and is the richest mode.
To inspect a local server, pass the command that starts it as an argument:
Terminal
npx @modelcontextprotocol/inspector node build/index.jsTo open the interface with no target and add servers via the UI itself:
Terminal
npx @modelcontextprotocol/inspectorThe command prints a URL with an API token per launch and opens the browser. The token protects the /api routes, because the server can execute processes on your machine. Do not type localhost:6274 from memory: use the printed URL.
To disable automatic browser opening, set MCP_AUTO_OPEN_ENABLED=false.
How to run in CLI mode
CLI mode is scriptable and returns results in text or JSON. It is ideal for CI, shell pipelines and code agents that need to verify a change quickly.
To list the tools of a server:
Terminal
npx @modelcontextprotocol/inspector --cli node build/index.js --method tools/listTo call a tool and extract the result with jq:
Terminal
npx @modelcontextprotocol/inspector --cli https://api.example.com/mcp --transport http \
--method tools/call --tool-name get_weather --tool-arg city=Boston --format json | jq .resultEach execution connects, makes a request and exits. For flows that require an open session (tasks, subscriptions, elicitation), use mcpdo.
How to run in TUI mode
TUI mode is an interactive terminal interface, useful when no browser is available.
Terminal
npx @modelcontextprotocol/inspector --tui node build/index.jsNavigation and keyboard shortcuts are documented on the TUI reference page.
Inspecting local and remote servers
For a stdio server, pass the startup command as a positional argument. Use -- to separate server arguments from Inspector arguments:
Terminal
npx @modelcontextprotocol/inspector node build/index.js -- --verbose --config /etc/myserver.confTo pass environment variables and working directory:
Terminal
npx @modelcontextprotocol/inspector -e API_KEY=abc123 -e REGION=us-east-1 --cwd ~/projects/my-server \
node build/index.jsFor a remote HTTP or SSE server:
Terminal
npx @modelcontextprotocol/inspector --server-url https://api.example.com/mcp --transport httpInspector supports the transports http (Streamable HTTP) and sse. If the server responds with 401, Inspector runs the OAuth flow described in the authorization documentation and tries again.
Always read the server README before inspecting. Each server requires different commands and arguments.
Using in CI and automated workflows
The CLI mode returns distinct exit codes for each situation, which makes integration in pipelines easy. Use --format json to get structured output and --strict to turn the schema portability check into a gate.
A typical smoke test flow:
- Connect with initialize to confirm the server responds.
- List tools with tools/list.
- Call a tool with tools/call and check the result.
- Make assertions with jq or with the pipeline code.
The Inspector also imports existing MCP client configurations, which makes it easy to reuse the same server list in development and in CI.
Security and secrets
The Inspector stores secrets (OAuth tokens, client secrets and env values from stdio servers) in the operating system keychain when available. On machines without a keychain, such as Linux without libsecret, SSH sessions, Termux and containers, secrets go to ~/.mcp-inspector/secrets.json, unencrypted, unless you provide a key.
The per-launch API token protects the /api routes, but it is not a strong authentication mechanism. On machines where other processes can reach the port, configure DANGEROUSLY_OMIT_AUTH carefully.
For stdio servers, the process stderr appears in the Console tab, which is where most servers put their diagnostics. Check that tab first when a connection fails for no apparent reason.
Protocol eras
The Inspector supports two protocol eras: legacy and modern (2026-07-28). The default is legacy. To test modern behavior, set the era in Server Settings or pass --protocol-era legacy|auto|modern on the command line.
The documentation details how each tab changes between eras, including standardized Mcp-* headers and tasks.
Frequently asked questions about the MCP Inspector
What is MCP Inspector?
It is the reference tool for testing and debugging MCP servers. It lists tools, calls functions, reads resources, inspects prompts and tracks JSON-RPC traffic.
Do I need to install MCP Inspector globally?
No. It runs via npx, with no global install. You just need Node.js 22.19.0 or newer.
How to use MCP Inspector in CI?
Use npx @modelcontextprotocol/inspector --cli followed by the server command and --method. Output can be JSON with --format json and integrated into pipelines.
Does MCP Inspector work with remote servers?
Yes. Use --server-url with the server address and --transport http or sse. If the server returns 401, the Inspector runs the OAuth flow automatically.
Where does MCP Inspector store secrets?
On machines without a keychain, secrets are saved in ~/.mcp-inspector/secrets.json without encryption. Provide a key or use the system keychain for greater security.
Conclusion
The MCP Inspector is the missing tool in the MCP server development cycle. With web, CLI and TUI modes, it covers everything from manual exploration to CI automation. The CLI mode in particular lets code agents verify changes to MCP servers quickly and reproducibly.
If you build or consume MCP servers, add the Inspector to your workflow. It reduces debugging time and helps detect schema, transport and authentication issues before they reach production.
Did the MCP Inspector catch your attention? Put this new tool to work in an AI agent squad, each one in its role.
mcp-server-git: MCP Git for AI CLIs
How to create an MCP server in TypeScript from scratch
Source: Model Context Protocol
Tags:#radar#ia#mcp
Developer and creator of bridgecode, an agentic development environment for orchestrating squads of AI agents. Helps people going from vibe coding to professional development move from idea to shipped product.
Related articles
Dicas
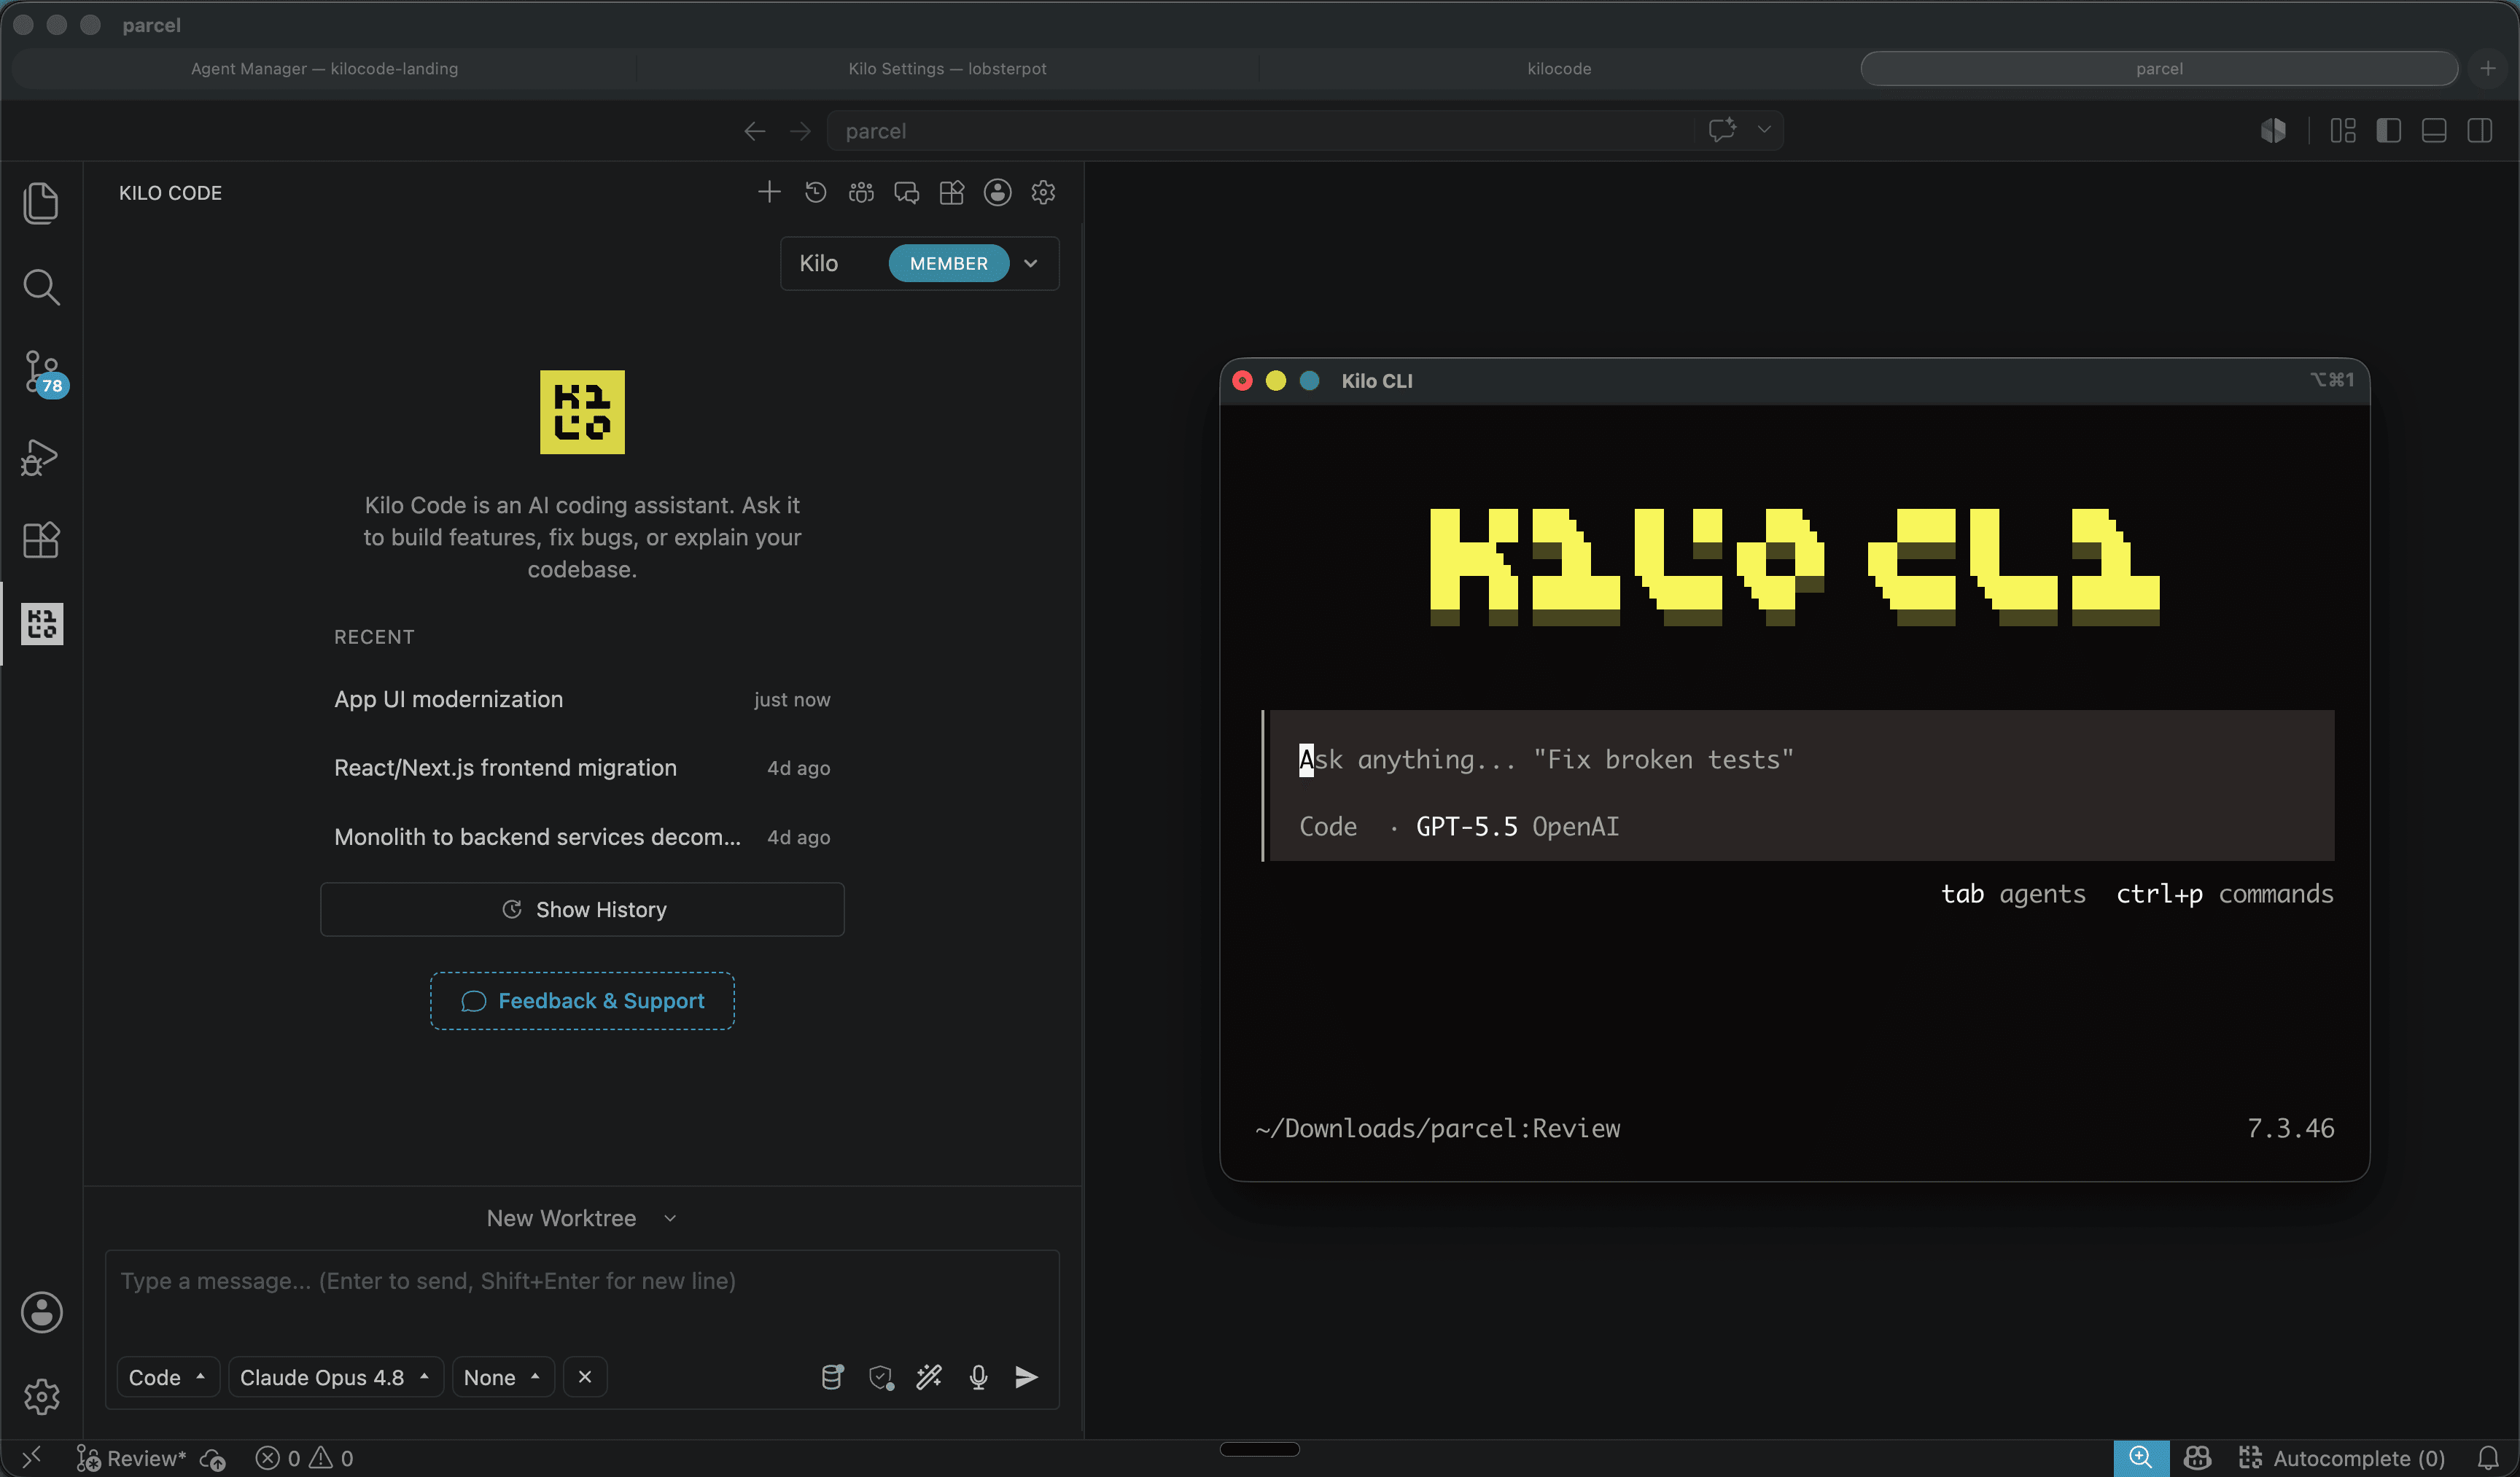
Kilo Code: open source coding agent for VS Code and CLI
Kilo Code is an open source coding agent for VS Code, JetBrains and CLI, with more than 500 models and provider direct pricing.
6 min

Dicas
How to use SuperCLUE to choose an AI model
The November 2026 SuperCLUE covers 19 models and category leaders. This guide shows how to use the category view to pick the right model.
5 min
Dicas
How to migrate Agents SDK v0.33.0 to Pi 1.5
Agents SDK v0.33.0 updates PiHarness to Pi 1.5. See the changed APIs, rollback risks, and a validation roadmap.
6 min